ABI Research
Summer of 2011, I worked for ABI Research, a market research company. They have some very big-name clients, and have been featured in publications such as Fast Company. Working for such a great company was a thrill, and I loved every second of it.
Being a research company, ABI's greatest asset is it's data. I was given the task of writing data visualization widgets for them, and I was set on presenting it in a clear and intuitive way.
I used Dojo Toolkit to write all the javascript-heavy things for them. The widgets/applications I wrote included the following:
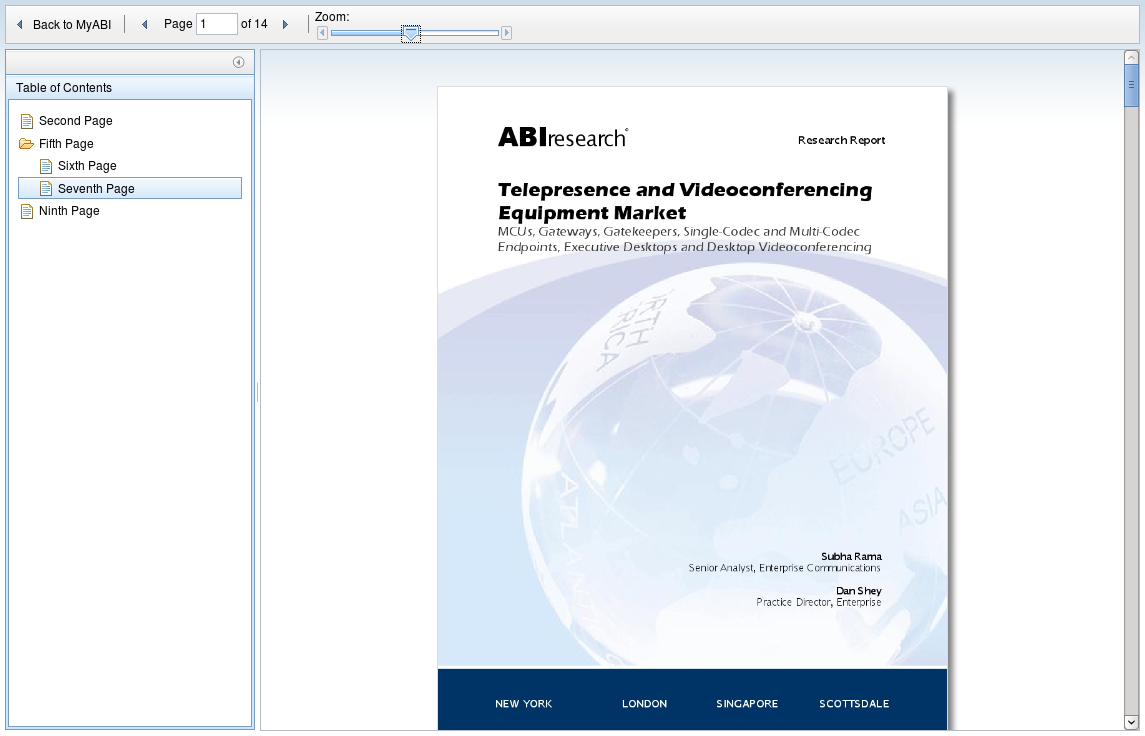
- An online PDF viewer
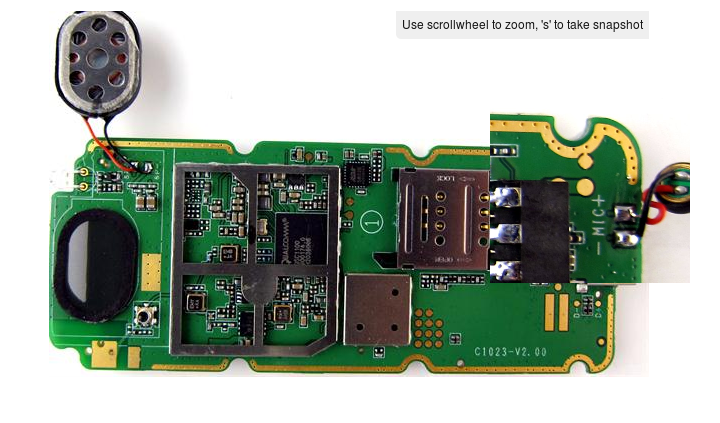
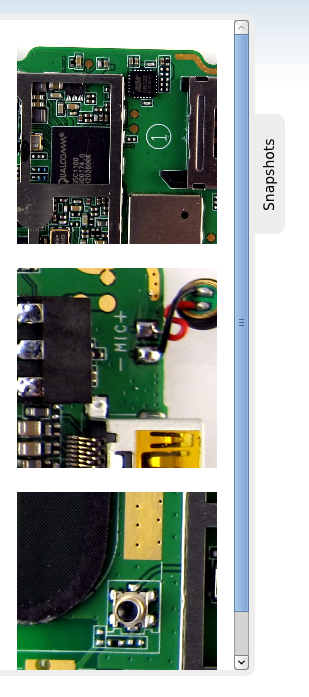
- A phone teardown viewing widget (with zoom functionality, as well as the ability to save snapshots)
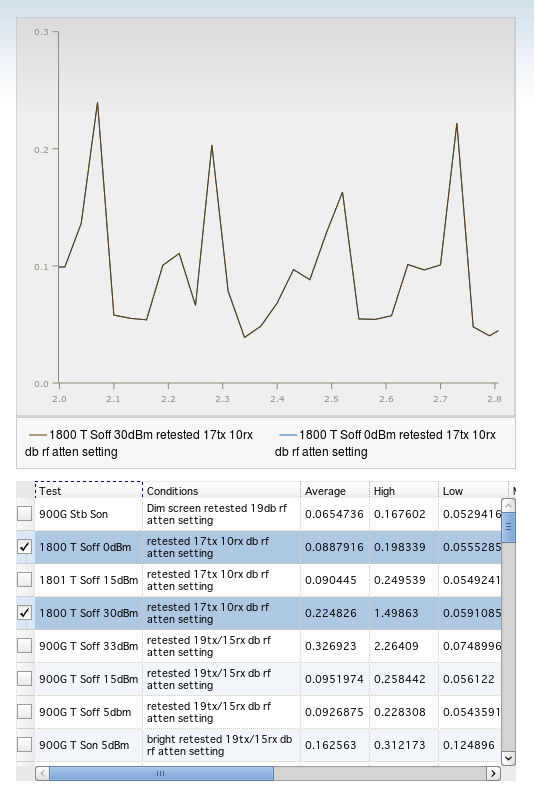
- A charting widget for viewing power usage of various phone components
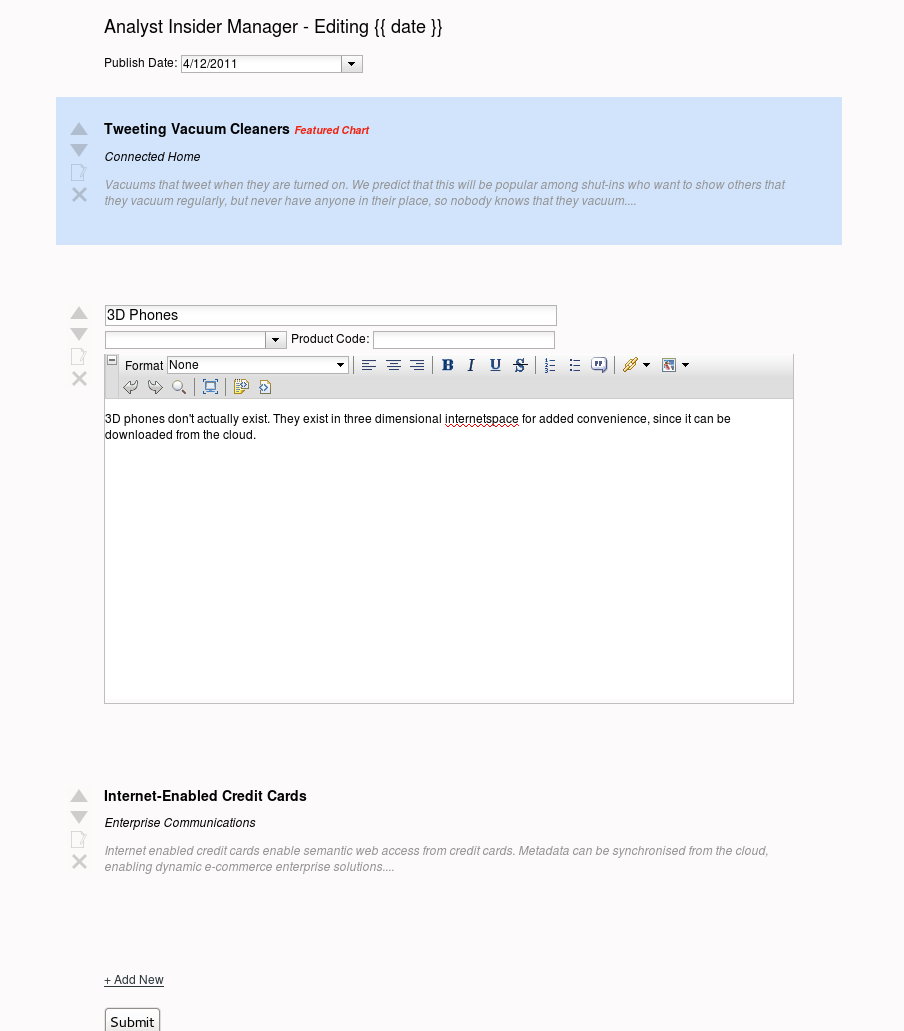
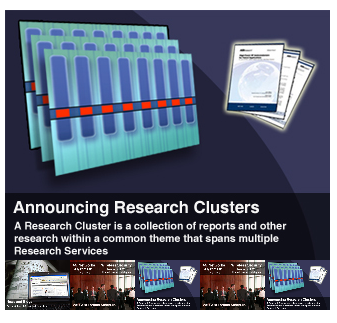
- A promotion carousel widget (was featured on the website's frontpage at the time)
- An internal tool that was used to send weekly newsletters to a large volume of subscribers
- A python script that publishes items from several RSS feeds to a twitter account
Focus was placed on creating the most usable interfaces possible within the given time frame.